Quality Improvement is the business of making healthcare better. This is based on the same systems that drove Toyota to become a world leader in making cars. They concentrated on constantly making their processes better. Seems like the same should apply to healthcare. In fact, Paul Batalden said, “In healthcare everyone has two jobs: to do your work and to improve it.” This is not only about reducing errors to improve patient safety but to improve healthcare even when nothing is going wrong.
Overview of the Model for Improvement
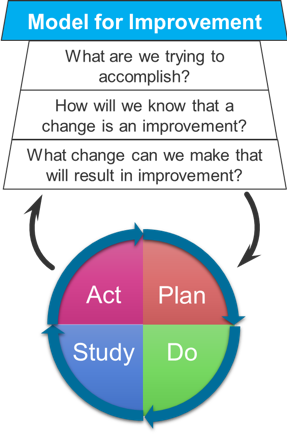
The Model for Improvement is usually depicted as a trapezoid sitting on top of a ball. The trapezoid contains the three fundamental questions:
- What are we trying to accomplish? This is encapsulated by an AIM statement with these components: how good, by when, for whom.
- How will we know that a change is an improvement? We need to select measures or metrics before we try to change something. You can’t rely on memory to see if a change happened. Plan ahead to collect the data you’ll need. This is our benchmark metric.
- What change can we make that will result in an improvement? What small change can we make that will result in an improvement? There are lots of ways to come with ideas.
Once we’ve done this, it’s time to run experiments. These are the PDSA cycles. We will run through iterations of these PDSA cycles, making small adjustments each time based on what we learn until we hit the benchmark metric. The PDSA cycle has four parts:
- PLAN: design an experiment to test your proposed change
- DO: do the experiment
- STUDY: study the results
- ACT: decide what to do based on those results. Based on a somewhat successful test you may want to make a small adjustment to the proposed change and retest. If the test was a failure, you may want to scrap the proposed change and go back to the drawing board. If the test hit the benchmark metric, perhaps you test it on a bigger scale.
The Institute For Healthcare Improvement
The Model for Improvement comes from the Institute for Healthcare Improvement. This is an independent, not-for-profit organization helping to lead improvement in healthcare around the world. It was founded by a pediatrician, Don Berwick, in 1991.
The Triple Aim
The IHI’s Triple Aim of improvement is to provide
- better care to
- improve the health of populations at
- a lower cost.
They define “better care” over six areas (that spell STEEEP, note the extra “E”).
- SAFE: Avoid injuries to patients from the care that is intended to help them. Reduce hazards and risks
- TIMELY: Reduce waits and sometimes harmful delays for patients and providers. Avoid delays.
- EFFECTIVE: Provide the appropriate level of services based on scientific knowledge. Matching science to care.
- EFFICIENT: Avoid waste, including waste of equipment, supplies, ideas, and energy. Avoid waste.
- EQUITABLE: Care shouldn’t vary in quality because of personal characteristics. Closing the gap (in race, SES, etc).
- PATIENT-CENTERED: Provide care that is respectful of and responsive to individual patients. People should make decisions about what effects them
One of the goals is also to increase value = (quality / cost). Contrast this from profit. Our goal should not be to maximize revenue. We need to increase the quality of the care we give to our patients as low a cost as possible. Reducing cost doesn’t come from cutting corners but through reduction of waste in failures of care delivery, failures of care coordination, overtreatment, administrative complexity, pricing failures and fraud and abuse.
Understanding Systems
To make improvements in healthcare we need to understand how systems work. Most of the problems in healthcare are not the result of uniformed or unmotivated people, but rather problems with the system in which they work. As W Edwards Deming (Bell Labs Engineer, electrical engineer and statistician) said, “every system is perfectly designed to get the results it gets.” If we want different results, we need to change the system.
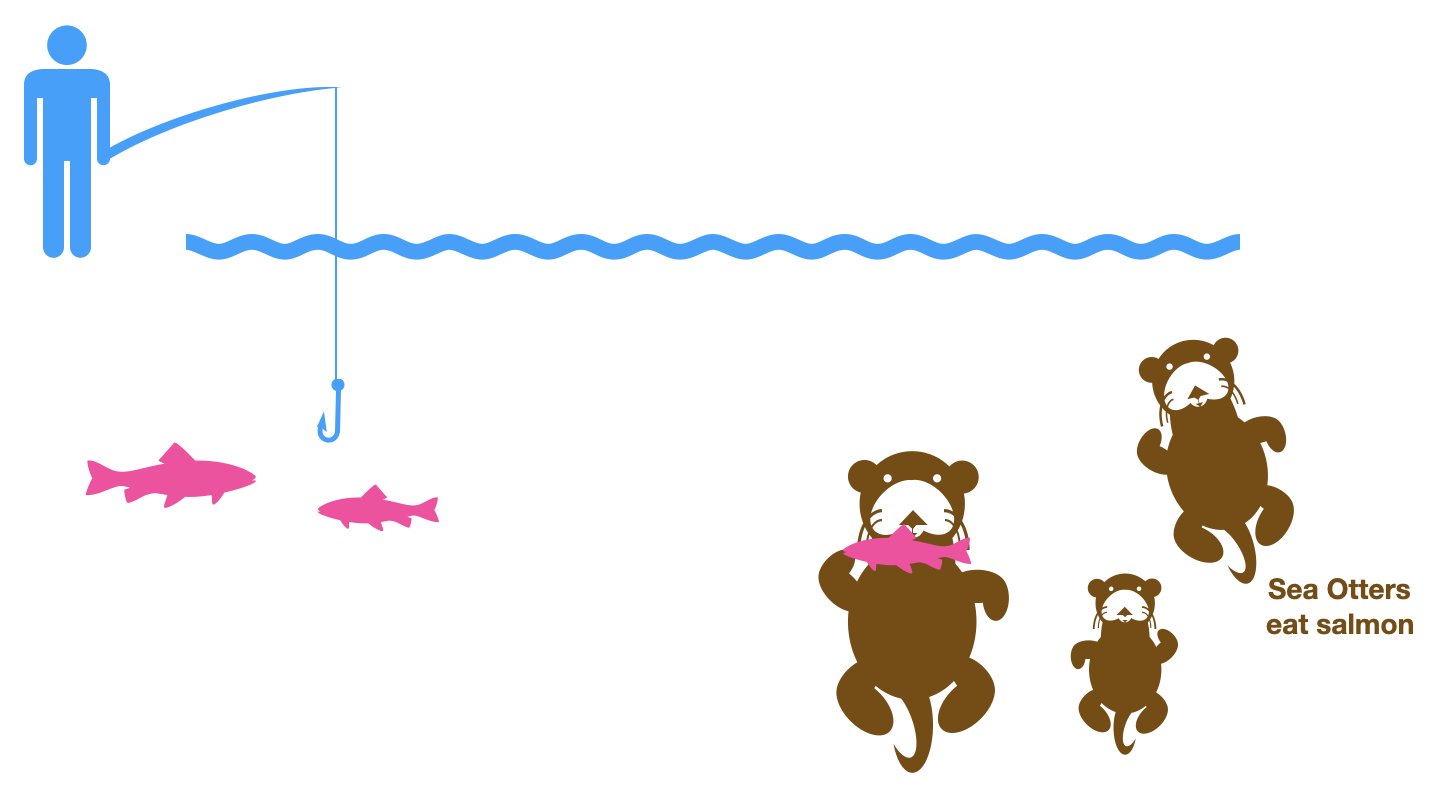
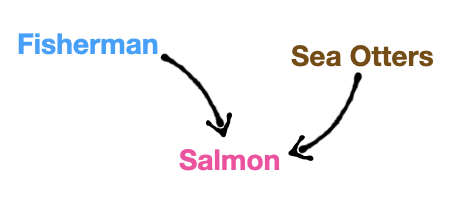
Ian Bradbury tells a story of salmon fisherman who were killing off sea otters to increase their yield of salmon. Their thinking was that the sea otters were eating the salmon, so if they got rid of the competition there would be more fish for the fishermen. However, upon killing the sea otters yields initially rose then subsequently fell. When all the sea otters were dead, there were no salmon to be found. What happened?! The fishermen misunderstood the system in which they were working. In their model there were only salmon and sea otters. They had a simplified view of the system.
The real world was much more complicated than that.
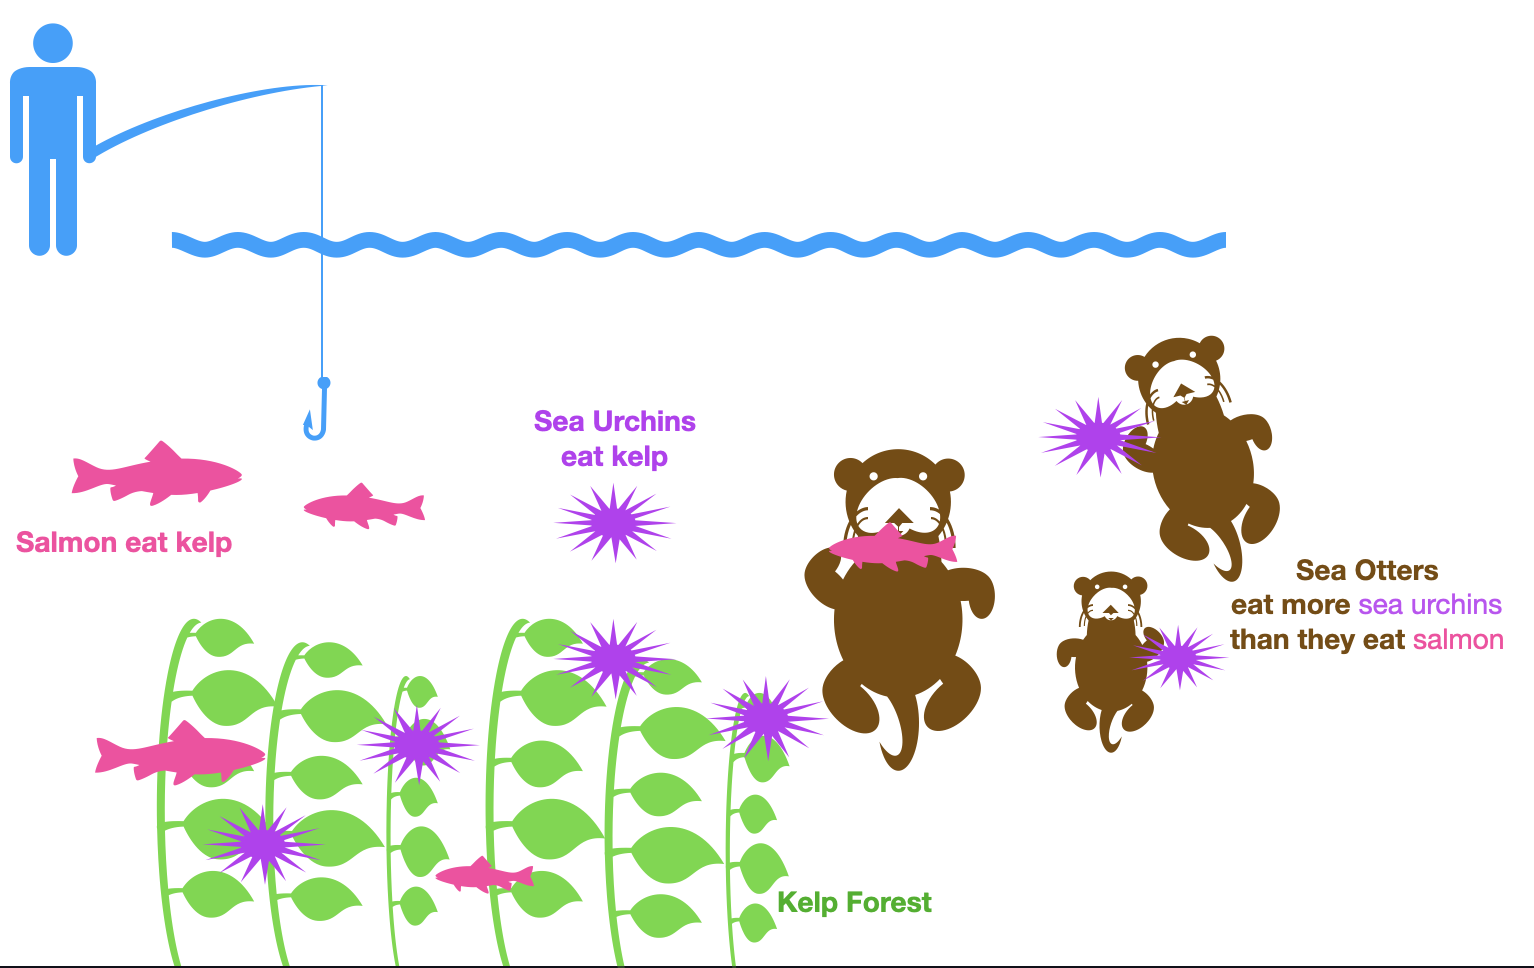
In reality, sea otters did eat salmon, but they much preferred the slower and easier to catch sea urchins in the water. The sea urchins themselves ate kelp, the same food source as the salmon. By killing off the sea otters, the sea urchins were able to thrive and eat off all the kelp leaving little for the salmon. Hence the salmon population diminished.
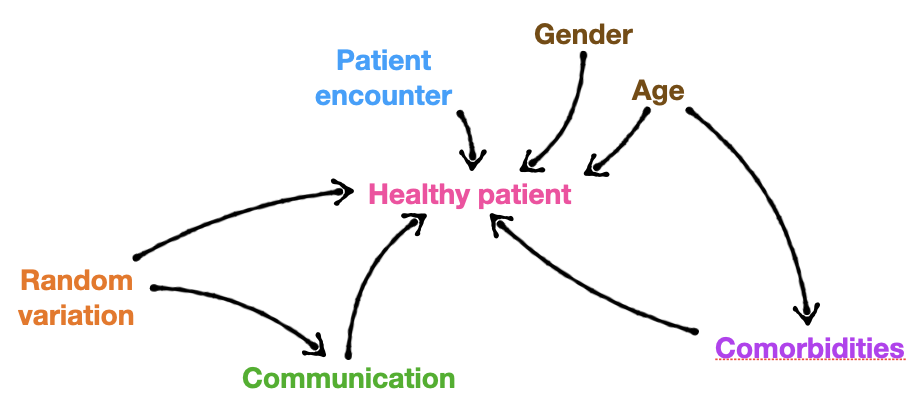
Healthcare is similarly complicated. Actually much more so. In a simplified view, a provider’s care leads to good health outcomes in the patient.

Obviously, there are a lot more factors at play including the patient’s motivations, comorbidities, socioeconomic factors, random variation, communication breakdowns, etc.
The Lens of Profound Knowledge
In order to make change, you need to understand a system on many levels. It is not enough to have a theoretical understanding of how something should work. You also need to know how this theoretical understanding works in the real world. This is what Deming called “profound knowledge.” We need to look at systems through this lens. It comprises four parts:
Appreciation of a system
A system is a network of interdependent parts working together to achieve a common aim. All parts of the system benefit from attaining the goal. Drawing a system map can often help with understanding the system, such as locating bottlenecks etc. The drawing of the sea otters, kelp, salmon and fishermen above is a crude system map that helps us understand what is happening.
- principle of interdependence: you cannot change individual pieces but need to optimize the whole system.
- central law of improvement: every system is perfectly designed to deliver the results it produces.
Psychology of human behavior
This is the human side of change. People are all fundamentally different and will interact with the system in different ways. Differences in levels of needs, values, priorities make us interact differently with the system. What motivates us? Fear (sticks) makes us find short term solutions. Rewards (carrots) and internal motivation can lead to longer lasting change.
- fundamental attribution error (attribution effect or correspondence bias): assumes a person’s actions depend more on the kind of person they are than the social and environmental forces influencing the person, assuming bad intention. In other words, when someone does something wrong, we blame it on them instead of the system.
Understanding variation
Everything varies. Things don’t always go the way we’d expect them to go. To understand variation in a metric we can plot it over time.
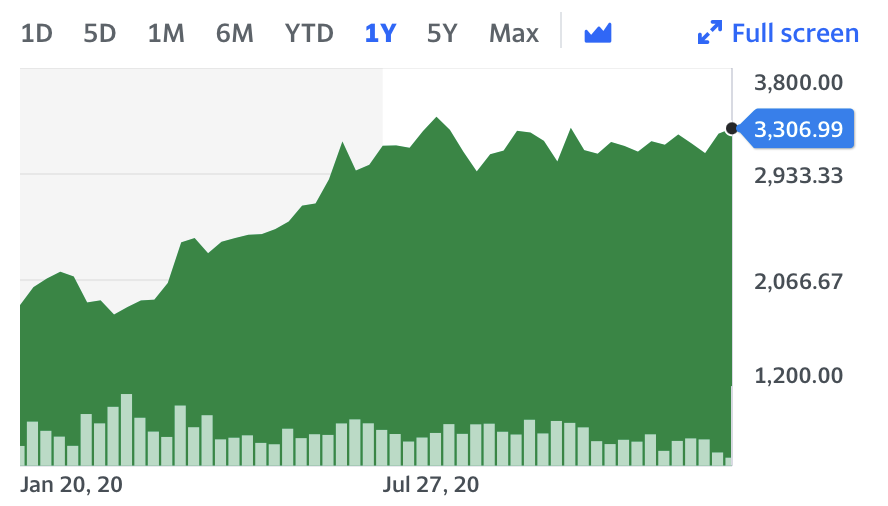
Much like a stock price can go up and down over time, we can see that there is a general upward trend in the Amazon stock depicted above. Similarly we can plot a metric such as % of providers washing their hands and see if we see the normal up-down variation that represents no change or an upward trend of a successful incentive to get people to wash their hands.
There are two types of variation:
- common: this variation is predictable and comes from within the system (intrinsic). A stable process will have only common causes. Since we can predict these will occur, we can put processes in place to control for them.
- special: this variation is from unusual events outside the normal operation (extrinsic). This is unpredictable and hard to control for.
Theory of knowledge
This is the understanding of the concepts behind something, We want to understand well enough to make predictions. If our predictions are incorrect, we have to revise our theory. Comparing predictions to observation is a source of learning.
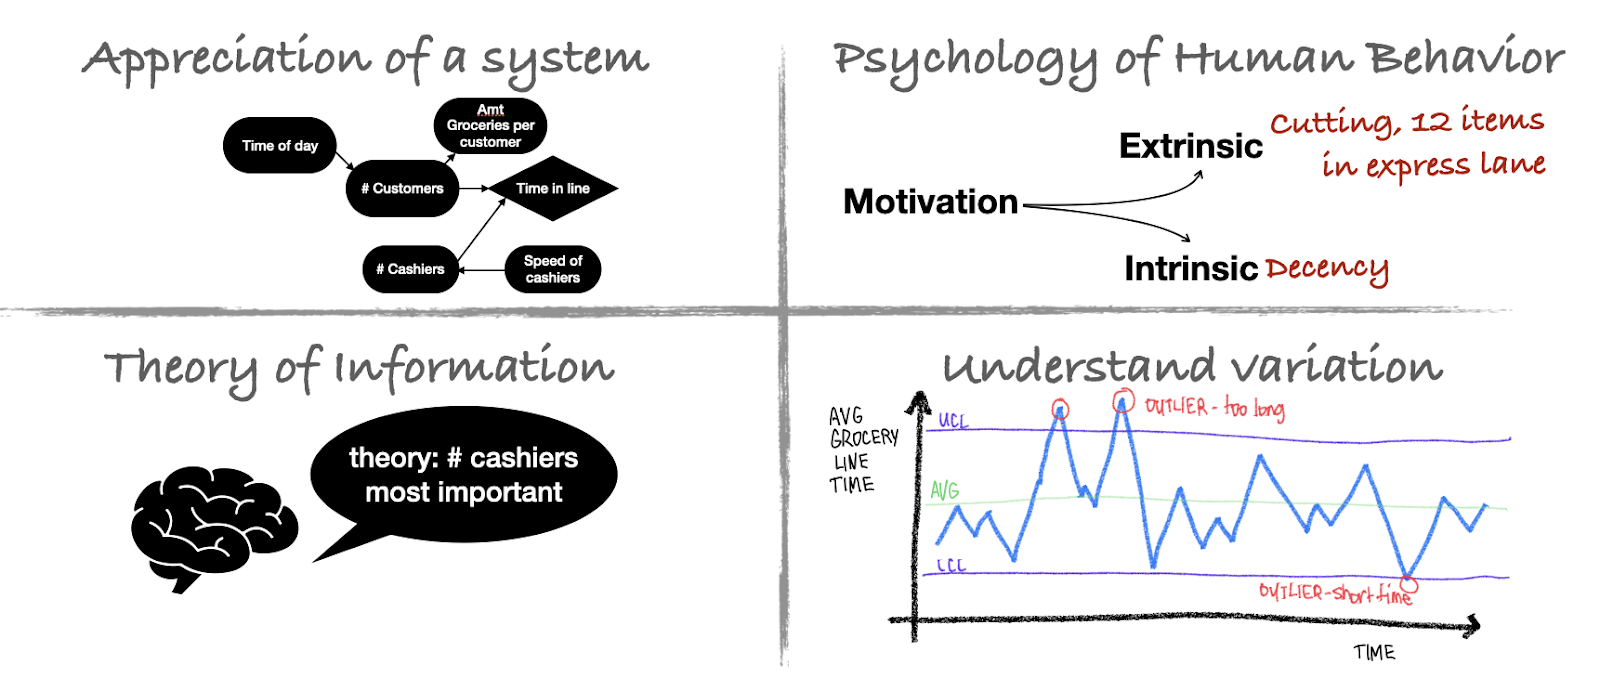
When looking at a problem, approach it using this lens of profound knowledge. These can be depicted using a 2 x 2 table. Fill in each of the potential types of change that may be present.
If we’re looking to make the lines at the grocery store go faster, we can look at it from different perspectives.
- First understand the system. What are all the factors at play and how do they interrelate? Draw a system map. The number of cashiers matter. The number of customers matter and that is dependent on the time of day (people always show up after work).
- Understand the psychology of human behavior. Why do people stand in one line or another? Why do people cut? Why do they have 12 items in the 10-items or less line.
- Understand the theory. You may look to the field of queuing theory for inspiration.
- Understand variation. You can plot average grocery store line time over a week and see where we have outliers.
Once we start understanding how the system works, we can start working toward making improvements.
“In healthcare everyone has two jobs: to do your work and to improve it.”
Model For Improvement
The Model for Improvement, developed by Associates in Process Improvement, is a simple yet powerful tool for accelerating improvement. This model has been used successfully by hundreds of healthcare organizations in many countries to improve many different health care processes and outcomes.
Remember this process is often depicted with a trapezoid (with the three fundamental questions) sitting on a circle (depicting the several PDSA cycles that’ll be run). Not depicted in this image is a box underneath it all that says “implement changes.” Once we find a change the meets the benchmark metrics, and we’ve thoroughly tested it in different environments (eg., the pediatric clinic and the geriatric clinic, the OR and the ER) and at large enough scale, then we can start widespread implementation. That is a science in and of itself.
Once we have a pretty good understanding of the system we can get started.
STEP 1: Write an aim statement
The Aim Statement should state what you are trying to accomplish, including: How good? By when? For whom? If you’re trying to improve your jogging, saying “I’d like to become a really good runner” would be too vague. Instead you can set a more specific aim “Five weeks from today, I will be able to run 5.3 miles in 50 minutes.”
What’s a good Aim to pick?
- Pick something that improves one of the STEEEP goals.
- Set incremental goals to work toward a bigger goal. Follow these four guidelines for setting aims statements:
- Set one now (make a decision, there’s no perfect one, you can revise later)
- Make sure the aim is meaningful.
- Set an aim you can track.
- Be ambitious.
STEP 2: Select Measures
List the Outcome Measures you ultimately want to affect. This should be something you can quantitatively measure, meaning it’s feasibly measured and it has a numeric value. Try to use a metric that someone is already measuring. There are three types of metrics you should measure.
- Outcome measures: the ultimate result, the goal you want to move. I want to run a 10 minute mile by five weeks from now.
- Process measures: measure if parts of the system are performing as you expect to affect the outcome measure. I am running at least 20 miles a week, 5 days a week.
- Balancing measures: did we introduce problems elsewhere. Do I now have knee pain from all this running?
Success is determined by meeting your metric. You’ll need to either “adapt, adopt or discard” depending on if the metric showed slight improvement, improvement or worsening.
So how do you pick good measures? Make sure you can answer the following questions:
- What do you want to learn about and improve?
- What measures will be most helpful for this purpose?
- What is the operational definition for each measure? It needs to be unambiguous. Don’t say “better” but how exactly is it “better”?
- What is your goal? What is the number you’d like to achieve? If you can’t get 100%, is 75% okay?
- What’s your baseline? Where are we now?
Here are some examples if our aim is to reduce patient falls.
- Outcome measures: # falls, % of patients who fell, falls rate (falls/inpatient-days)
- Process measures: % of pts assessed for falls, % of pts reassessed after 24h, # times pt is monitored, # times nurses rounded on patients — these we believe will have an effect on the number of falls.
- Balancing measures: decreased allowed mobility of patients (which can lead to deconditioning, blood clots, etc). Reflect how the system is being disturbed by outcome: volume of patients, finance, flows/throughput — basically things that affect or are affected by the outcome measures
Other considerations:
- who will collect the data
- how often
- what is included/excluded
- how will data be collected and stored?
“Seek usefulness not perfection.”
We want just enough data to learn. We don’t collect info from everyone, just take a sample. Then plot that sample data over time and display the charts.
- SIMPLE RANDOM SAMPLING: pick at random
- PROPORTIONAL STRATIFIED RANDOM SAMPLING: divide into groups and take random samples from each group
- JUDGMENT SAMPLING: not random, but people with knowledge of system will pick the patients
STEP 3: Pick a change to test
While reactive changes are often necessary, proactive changes can lead to better results. These are more than simple tweaks of the system. We may redesign parts of a system or make a whole new system, to improve a system that isn’t plagued by problems. It may fundamentally alter how a system works or what people do.
Look to your system map to think of places where changes can cause improvement. In the example of the fisherman, getting rid of the sea otters may not increase the yield of salmon however planting more kelp is worth a try. Test it and see what happens. Maybe we get more salmon. Maybe we get more sea urchins.
Listed below are several change concepts that can help you find ideas to change.
ELIMINATING WASTE
1. Eliminate things that are not used
2. Eliminate multiple entries
3. Reduce or eliminate overkill
4. Reduce controls on the system
5. Recycle or reuse
6. Use substitution
7. Reduce classifications
8. Remove intermediaries
9. Match the amount to the need
10. Use sampling
11. Change targets or set points
IMPROVING WORKFLOW
12. Synchronize
13. Schedule into multiple processes
14. Minimize handoffs
15. Move steps in the process close together
16. Find and remove bottlenecks
17. Use automation
18. Smooth workflow
19. Do tasks in parallel
20. Consider people as in the same system
21. Use multiple processing units
22. Adjust to peak demand
OPTIMIZE INVENTORY
23. Match inventory to predicted demand
24. Use pull systems
25. Reduce choice of features
26. Reduce multiple brands of the same item
CHANGE THE WORK ENVIRONMENT
27. Give people access to information
28. Use proper measurements
29. Take care of basics
30. Reduce demotivating aspects of the pay system
31. Conduct training
32. Implement cross- training
33. Invest more resources in improvement
34. Focus on core process and purpose
35. Share risks
36. Emphasize natural and logical consequences
37. Develop alliances and cooperative relationships
ENHANCE RELATIONSHIP WITH CUSTOMER
38. Listen to customers
39. Coach the customer to use a product/service
40. Focus on the outcome to a customer
41. Use a coordinator
42. Reach agreement on expectations
43. Outsource for “free”
44. Optimize level of inspection
45. Work with suppliers
MANAGE TIME
46. Reduce setup or startup time
47. Set up timing to use discounts
48. Optimize maintenance
49. Extend specialist’s time
50. Reduce wait time
MANAGE VARIATION
51. Standardization (create a formal process)
52. Stop tampering
53. Develop operation definitions
54. Improve predictions
55. Develop contingency plans
56. Sort product into grades
57. Desensitize
58. Exploit variation
USE SYSTEMS TO AVOID MISTAKES
59. Use reminders
60. Use differentiation
61. Use constraints
62. Use affordances
FOCUS ON THE PRODUCT OR SERVICE
63. Mass customize
64. Offer product/service anytime
65. Offer product/service anyplace
66. Emphasize intangibles
67. Influence or take advantage of fashion trends
68. Reduce the number of components
69. Disguise defects or problems
70. Differentiate product using quality dimensions
71. Change the order of process steps
72. Manage uncertainty — not tasks
Coming up with an idea for change will require critical and creative thinking and perhaps the use of technology. Read about what other people did, even in other industries.
STEP 4: Testing a Change
Changes in a system should not be introduced as a full implementation, but tested at a small scale that builds incrementally. Each iteration should make use of what was learned on the previous iteration. Start small and build up.
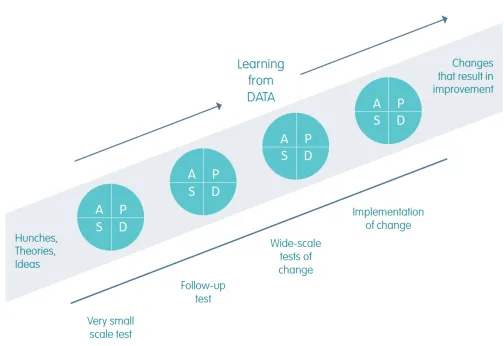
PDSA cycles are often depicted as a wheel that’s rolling. With each rotation, we learn something new. In the image above we see that successive PDSA cycles take us from “hunches, theories, and ideas” to “changes that result in improvement.” The entire time we are “learning from data.”
- Plan: Planning the change that you want to put in place and predicting what will happen through the cycle. Detailed work here includes deciding what data will be collected, who will do what, when and where the change will be implemented. This is like designing a research study, though much more practical and on a smaller scale. Remember the goal here is to learn from data.
- Do: Implement the change, and measure and gather the data as planned.
- Study: Analyze the before and after data to see what can be learned. Compare these results to your initial predictions.
- Act: Return to the start and decide what’s the next step. Do you run another cycle at a bigger scale? Do you alter your planned change and run another PDSA cycle? Or was it successful enough that you want to implement it and roll out the change?
Example from Blue Ox Medical Center, Minnesota
The ED Nurse Manager for the stroke center noted that patients who were treated for stroke were not getting enough appointments with their primary care physicians.
Fundamental questions:
- AIM: By June 2017, increase the number of follow-up PCP visits scheduled for stroke patients prior to discharge from 50% to 70%.
- MEASURES: Percentage of scheduled visits of discharged stroke patients with the primary care physician. We are starting at 50% and define success at a level of 70%.
- PICK A CHANGE: patients will have a follow-up appointment scheduled and noted in their charts before discharge.
PDSA Cycle:
- Plan:
- Describe change: follow-up appointment listed in chart before discharge
- Lists of tasks needed to set up to make this happen:
- Follow-up appointment will be built into the order set
- Develop training materials for the clerks
- Develop procedure for scheduling appointments on weekends and holidays
- Unit clerks will schedule the appointments during the week
- Appointment information included in the patient discharge information
- Appointment will be included in feedback loop document for hospitals and clinics
- Each of these has listed a person who is responsible for the task, when it is due, where it will be done and the current status.
- Predict what will happen: 10 consecutive patients will have a primary care appointment scheduled prior to discharge.
- Do:
- During the week, the unit clerks are scheduling appointments. On weekends and after hours, the appointments were not scheduled.
- Study: describe the measured results and how they compare to the predictions
- A review of charts during the week noted that the procedure worked well and the number of patients who left with appointments already scheduled increased. However on the weekend, appointments weren’t scheduled. On the following Monday, the clerks did not see the order for scheduling the appointments for those patients who left during the weekend. Seventy-percent of stroke patients did not receive follow-up appointments because of this.
- Act: what modifications to the plan need to be made for the next cycle based on what we learned
- The plan needs to be modified to address the patients who are discharged on the weekend. A subsequent plan could be that the inpatient nurse calls the patient’s primary care physician and makes appointments on Friday for all patients who are staying through the weekend. This now moves back to the Plan phase.
Selected References
- Introductory video from Dr. Mike Evans: https://youtu.be/nPysNaF1oMw
- The Model for Improvement: https://youtu.be/SCYghxtioIY
- The Model for Improvement Part 2: https://youtu.be/6MIUqdulNwQ
- The PDSA Cycle: https://youtu.be/_-ceS9Ta820
- The PDSA Cycle Part 2: https://youtu.be/eYoJxjmv_QI
- The IHI Open School. www.ihi.org (You can get a free account as a student)
- Introduction to QI video: https://youtu.be/nPysNaF1oMw
- Introduction to QI page at IHI: http://www.ihi.org/resources/Pages/HowtoImprove/ScienceofImprovementHowtoImprove.aspx
- Sea Otter story: https://deming.org/deming-101-understanding-systems/
- The Lens of Profound Knowledge: https://deming.org/deming-101-theory-of-knowledge-and-the-pdsa-improvement-and-learning-cycle
- Complete List of Change Concepts: http://www.calquality.org/storage/documents/16%20-%20change%20concepts.pdf
- Using Change Concepts: http://www.ihi.org/education/IHIOpenSchool/Courses/Documents/QI102_L4_APIChangeConcepts.pdf
- Developing ideas for Change: https://collegehealthqi.nyu.edu/improvement-journey/6-develop-ideas-for-change/
- PDSA Cycles: https://www.weahsn.net/toolkits-and-resources/quality-improvement-tools-2/model-for-improvement-pdsa/
- PDSA Cycle worksheet: https://www.cms.gov/medicare/provider-enrollment-and-certification/qapi/downloads/pdsacycledebedits.pdf
- PDSA Worksheet for Testing Change – Example: https://www.health.state.mn.us/diseases/cardiovascular/documents/examplepdsa.pdf