Summary of the process
What follows are steps for completing a root cause analysis. We’ll go into more detail for these in the text following the table. Much of this came out of the work of Sydney Dekker, who used it to evaluate airplane crashes. It applies well here to medicine as well.
| Event, hazard or system vulnerability | An adverse event or hazard is recognized, or a system vulnerability is identified. Take actions to care for the patient and make the situation safe for others. Sequester any equipment, products or materials that may be useful in analyzing what happened. |
| Risk-based prioritization | The patient safety or quality management team member performs the risk-prioritization. For consistency, one person should perform the analysis each time. |
↑↑ The above should happen within 72 hours of the event ↑↑
| Fact finding: what happened? | The first step is to figure out what happened, accurately and completely. Visit the site. Conduct interviews with patients and staff. Review equipment. Be sure to interview supervisors, but they shouldn’t prepare the report. Identify and fill gaps in knowledge. There are lists of triggering questions that can help start the process. Make a flow diagram to map out what happened. Start with known facts and add to it as you learn more. This may require several meetings with stakeholders and site visits. To quote Sydney Dekker, The fundamental question the team must answer is not where did people go wrong, but why did their action make sense to them at the time. |
Develop causal statements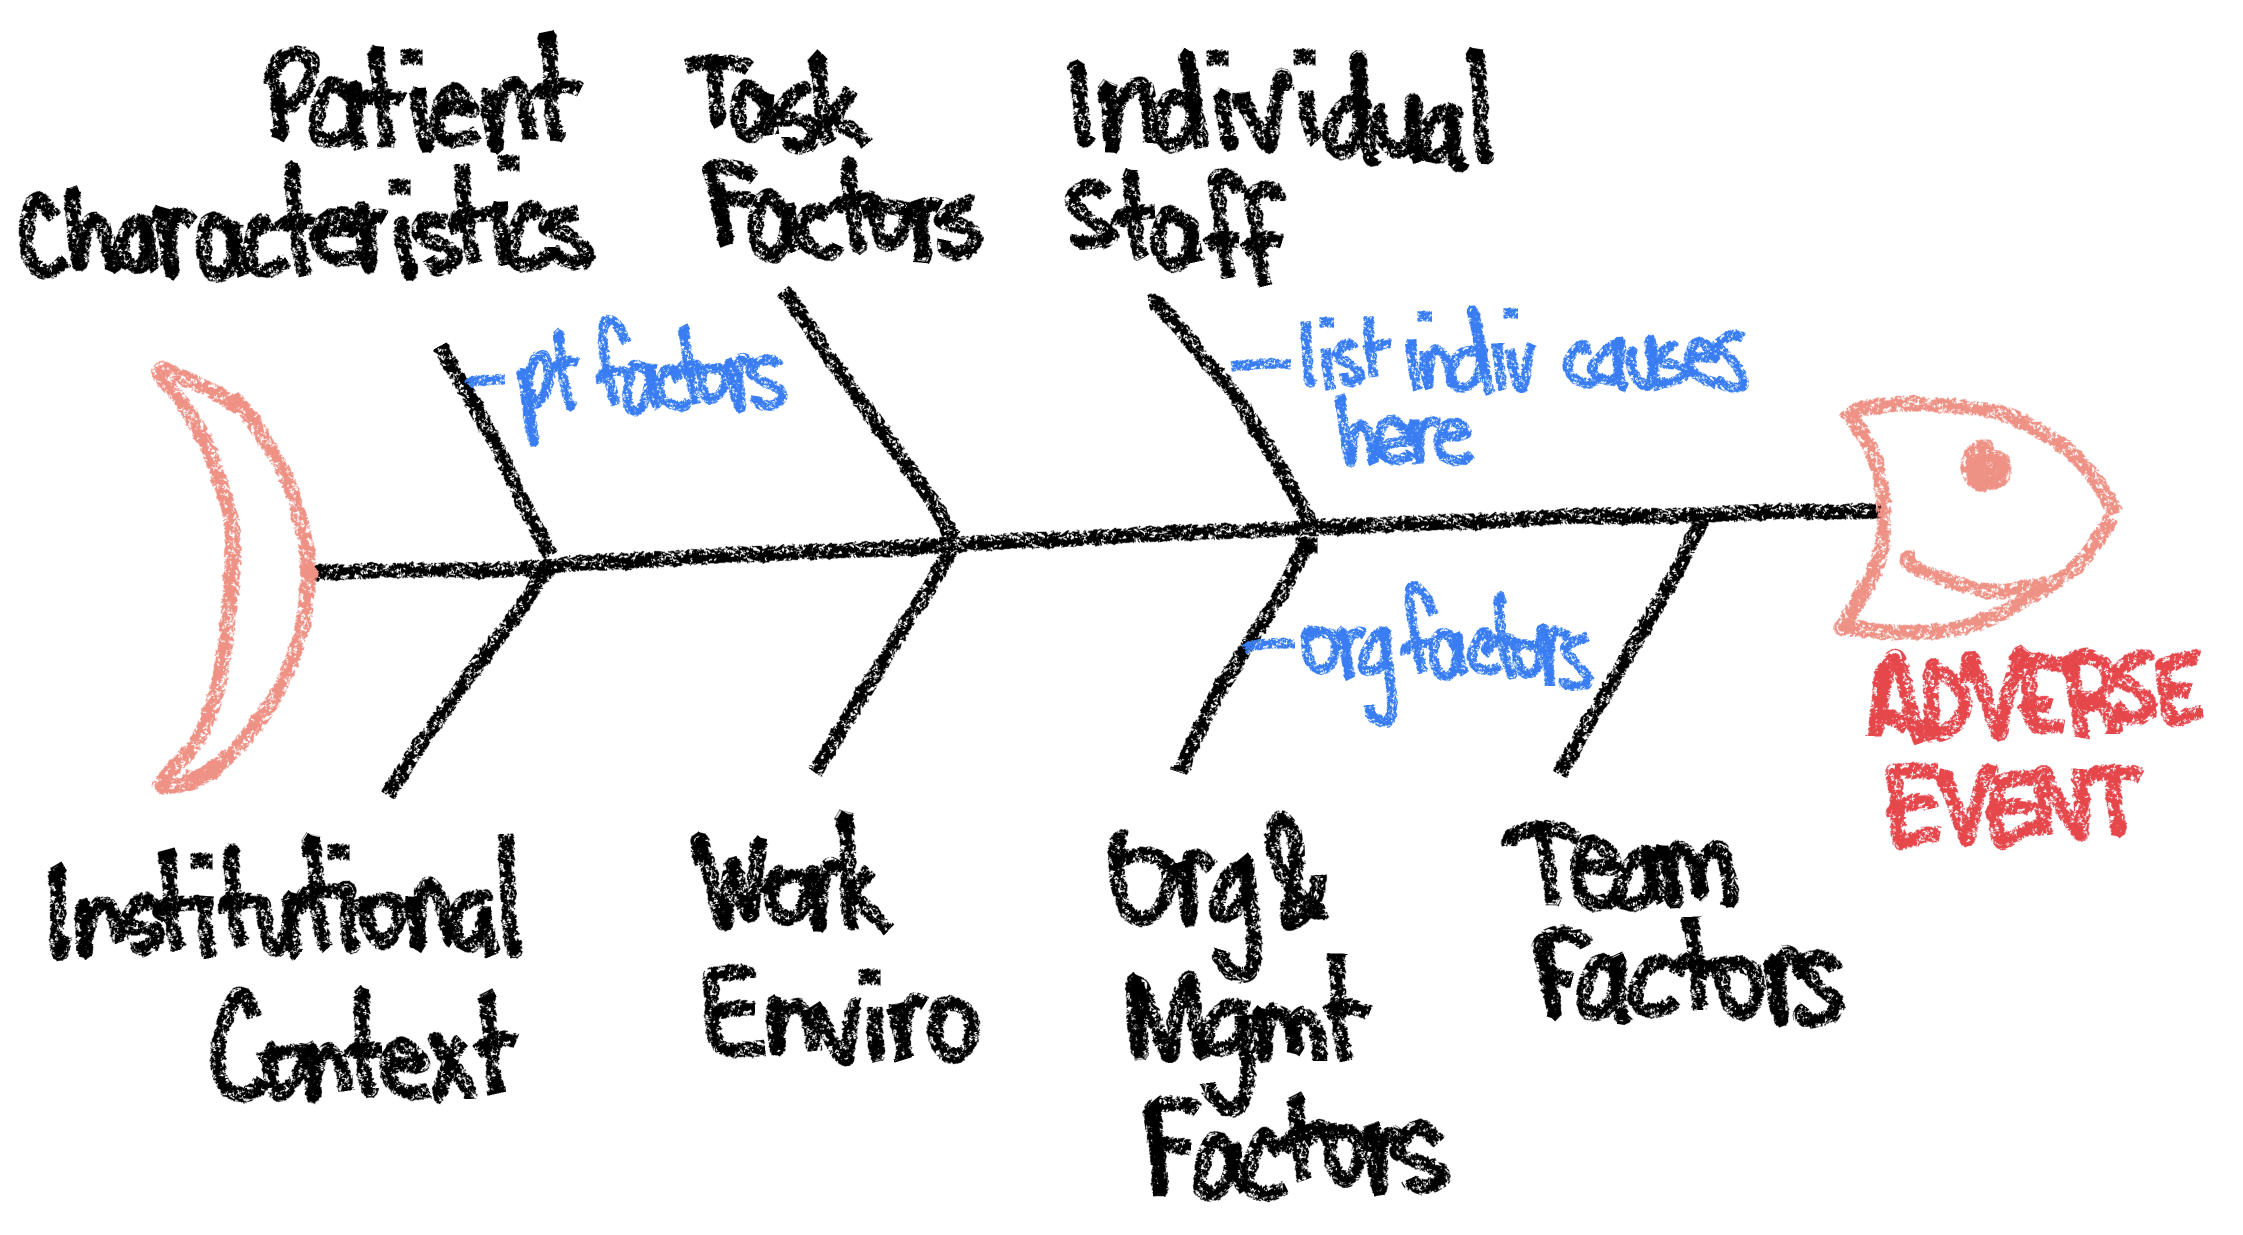 | Next we need to write down why we think the error or harm occurred. These causal statements are often written as: The cause (“This happened…”)The effect (“…which led to something else happening…”)The event (“…which caused this undesirable outcome.”) There are five rules for writing causal statements4: 1. Statements must show “cause and effect.” 2. Avoid negative descriptors like “poorly or inadequate.” Instead describe what happened. Don’t say “the resident made a poor medication choice.” Instead say “A high volume of activity and noise in the ER led to the resident being distracted.” 3. Each human error should have a preceding cause (ask why one more time). Knowing a human made a mistake is not enough to prevent it. 4. Each procedural deviation must have a preceding cause. If someone didn’t do what they were expected to do, we should know why. 5. Failure to act is only causal when there was a pre-existing duty to act. These can be recorded on the fishbone diagram. |
| Identify solutions and corrective actions | Finally, identify corrective actions that address the causes. See the action hierarchy of controls below. From most effective to least effective: – Eliminate hazards and opportunities for error – Make it hard to do the wrong thing – Make it easy to do the right thing – Make errors easily visible so you have time to course correct thus minimizing the effect of errors – Policies and additional training |
↑↑ The above should happen within 30-45 days. ↑↑
| Implementation | A responsible individual with the authority to act, not a team or committee, should be responsible for ensuring action implementation. |
| Measurement | Each action should have a process or outcome measure identifying what will be measured, the expected compliance level, and the date it will be measured. An individual should be identified who will be responsible for measuring and reporting on action effectiveness. |
| Feedback | Feedback should be provided to the stakeholders and leaders, patients and staff. Everyone would like to know that due to efforts made, they are now working in a safer system. Be sure to celebrate any wins. People need to know their efforts made a difference. |
The term Root Cause Analysis is a bit of a misnomer because there is usually more than one cause for every adverse event and the goal is not only to identify the cause but to act on it. A more accurate term would be Root Cause Analyses and Actions (RCA2).
For a root cause analysis and action plan to be successful, you need several key components:
- Active leadership engagement and support
- A non-punitive approach: focus on identifying system issues and not blaming individuals, people should not be scared to participate.
- Transparent, risk-based prioritization
- Timeliness: start within 72 hours while the event is fresh within people’s minds
- Effective team composition and patient engagement
- The application of tools including triggering questions, the five rules of causation, and the action hierarchy
- Providing feedback and celebrating wins
Step 1: Immediately after an adverse event
1a. Ensure patient safety & save any evidence
Once an adverse event has been recognized, we need to do a few things. The first thing is to do whatever is necessary to make sure the patient and others are safe.
Next we want to keep any equipment, medications, forms or other items that were involved in the adverse event off to the side so we can analyze it later.
1b. Report the adverse event
The event should also be reported via the hospital’s safety event reporting system. This does several things. First it lets people record their recollection of the event as close to the incident as possible. Next, it notifies the safety and quality team of the incident so they may start examining what happened. Finally, it allows the hospital to review cases under the legal protections of the quality umbrella. We want to be able to improve our processes with the goal of improving patient care without having to worry about medicolegal implications.
The entire quality improvement process should be a safe space to encourage providers to examine their errors. As such, it is protected under the Patient Safety and Quality Improvement Act of 2005 (Public Law 109-41), signed into law on July 29, 2005. However, plaintiff’s attorney’s can request these slides during discovery. Use our approved slide template which includes the appropriate language, for example:
This document is privileged and confidential under the Illinois Medical Studies Act and should not be shared or distributed other than through the Quality Assurance Committee structure.
1c. Building The Root Cause Analysis Team
Typically one team does the whole process within 45 days of the incident, including fact finding and flow diagramming, development of causal statements and identification of solutions and corrective actions. The team should
- Be an interprofessional including a patient and family representative (but not the patient or family affected by the adverse event)
- Consist of people at varying levels and consider including trainees. Senior leaders may inhibit the process if people are afraid to speak in front of them.
- Subject matter experts (of the incident) and the RCA2 process experts. The team leader should know both.
- Exclude those who were directly involved in the event, there is too much conflict of interest. However the team will interview them. The family should be interviewed and informed but also not part of the team itself. There are too many legal & psychological issues.
- Have time to complete all of this
- Be analytical, open minded, credible, know about RCA, and engaged willing participants
The team then needs to get training in RCA2. If it’s a rotating team, they all get the opportunity to learn. Have the team go through some didactics (like what we’re doing here), and then a practice case.
The team should choose the leader. The leader should have knowledge in RCA2, understand the system, strong writing skills and strong leadership skills (manage group dynamics, delegate and build consensus).
In order for a team to be effective first there needs to be respect among the members. Humiliating, passive-aggressive, passively disrespectful, dismissive (of patients or the system) behaviors hobble effectiveness. Even subtle disrespect such as not learning team member’s names or habitual tardiness for meetings are detrimental. Good leaders are approachable, invite others into the conversation and establish shared goals.
Secondly, the team needs to establish common goals. In healthcare this is usually based on achieving the best outcome for the patient. Often a set of agreed upon terms can allow someone to voice concern without placing blame or making accusations. Statements like “I need a little clarity” can both advocate for safety while the inquiry for understanding gives others rooms to explain themselves or adjust.
Step 2: Perform a Risk Based Prioritization
Not all events deserve an RCA. In order to decide which to pursue, we can place the event in a risk-based prioritization matrix. On one axis, we categorize the harm as catastrophic, severe, major and minor. Along the probability axis, we categorize it as frequent, occasional, uncommon or rare. Below is a copy of the table we use at Rush for our Safety Event Reviews.
Start by performing a root cause analysis on those adverse events that had a score of 3. If resources remain, then tackle the orange (2) ones.
| Severity (Actual or Potential) | ||||
| Probability | Catastrophic | Major | Moderate | Minor |
| Frequent | 3 | 3 | 2 | 1 |
| Occasional | 3 | 2 | 1 | 1 |
| Uncommon | 3 | 2 | 1 | 1 |
| Remote | 3 | 2 | 1 | 1 |
In the example above, our event is classified as catastrophic but only occasionally happens. This is in the red, so merits analysis.
This matrix is based on the one used at Rush.
Step 3: Fact Finding: figure out what happened
3a: Build a Thin Timeline
In airplane crashes, investigators recover the flight recorder (black box) to create a timeline of events during the flight and conversations between parties. In medicine, we look at the electronic health record to understand what happened and when.
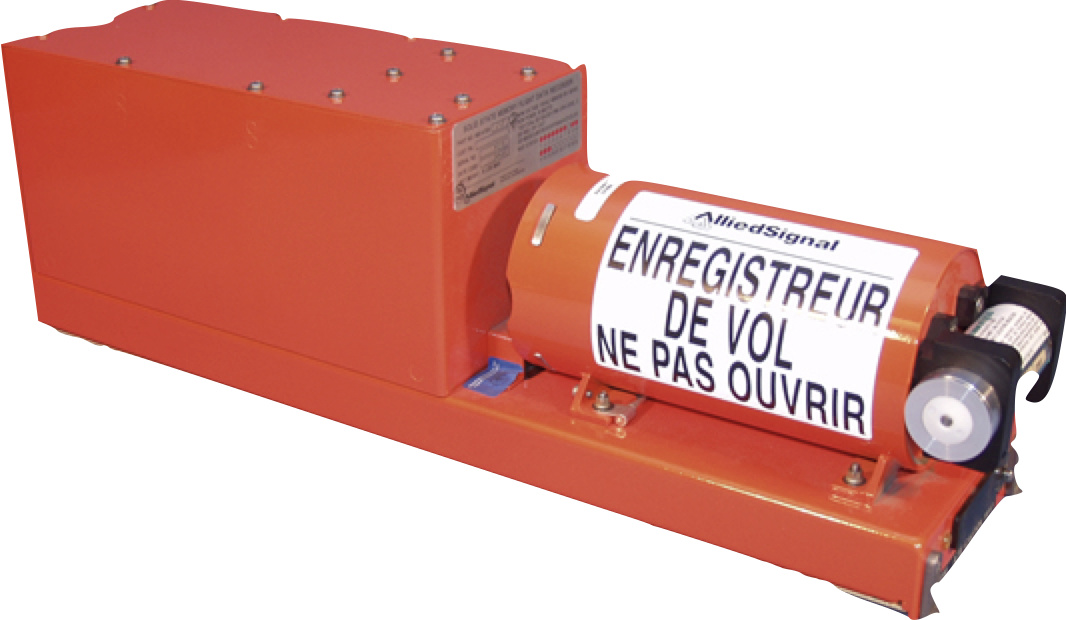
The airplane’s flight recorder, also known as the “black box.” I know, it’s orange. The British used to have them in black. Now they are orange so they are easier to find.
Review the data from the medical records and put the important information down on a timeline. Include the dates and times when things happened.
The team needs first to build a clear understanding of exactly what happened. This is best captured using a flow diagram. As the team gains more insight into the event, the diagram can be altered to reflect this new understanding. This is usually started as a bunch of Post-It notes stuck to a wall and rearranged as per the group’s discussion.
Start by putting known facts up on the wall and leave spaces where there are gaps in knowledge. Interview the people involved and visit the site to gain more information as to what happened. Once these gaps are filled we can add to the diagram.
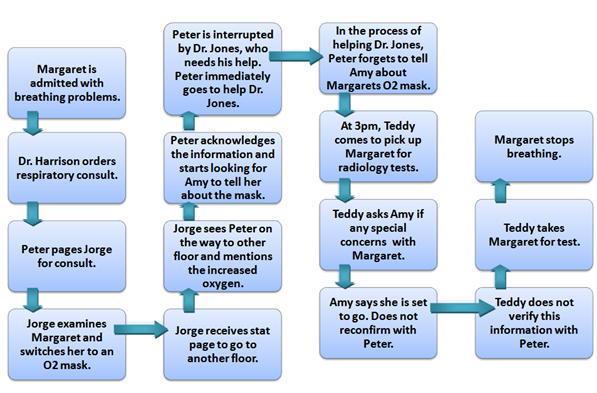
Example flow diagram of a patient who stopped breathing. Though the diagram doesn’t show it, we usually include date and time stamps on each of these events.
3b. Interview key players (collect human factors data)
Now go interview the people directly involved in the adverse event to understand what happened from their point of view. This is best done as early as possible as memory tends to degrade with time. Understand what was happening at the time, why did they make the choices they did, and what was their understanding of the situation and why.
The goal here is to get into their minds. We don’t want to understand the situation as a Monday Morning Quarterback but as the Sunday Afternoon Quarterback on the field. We want to understand why they made the decisions they did so much so that we could see ourselves making the same choices. This is the principle of local rationality. We want to understand their reasoning at the time.
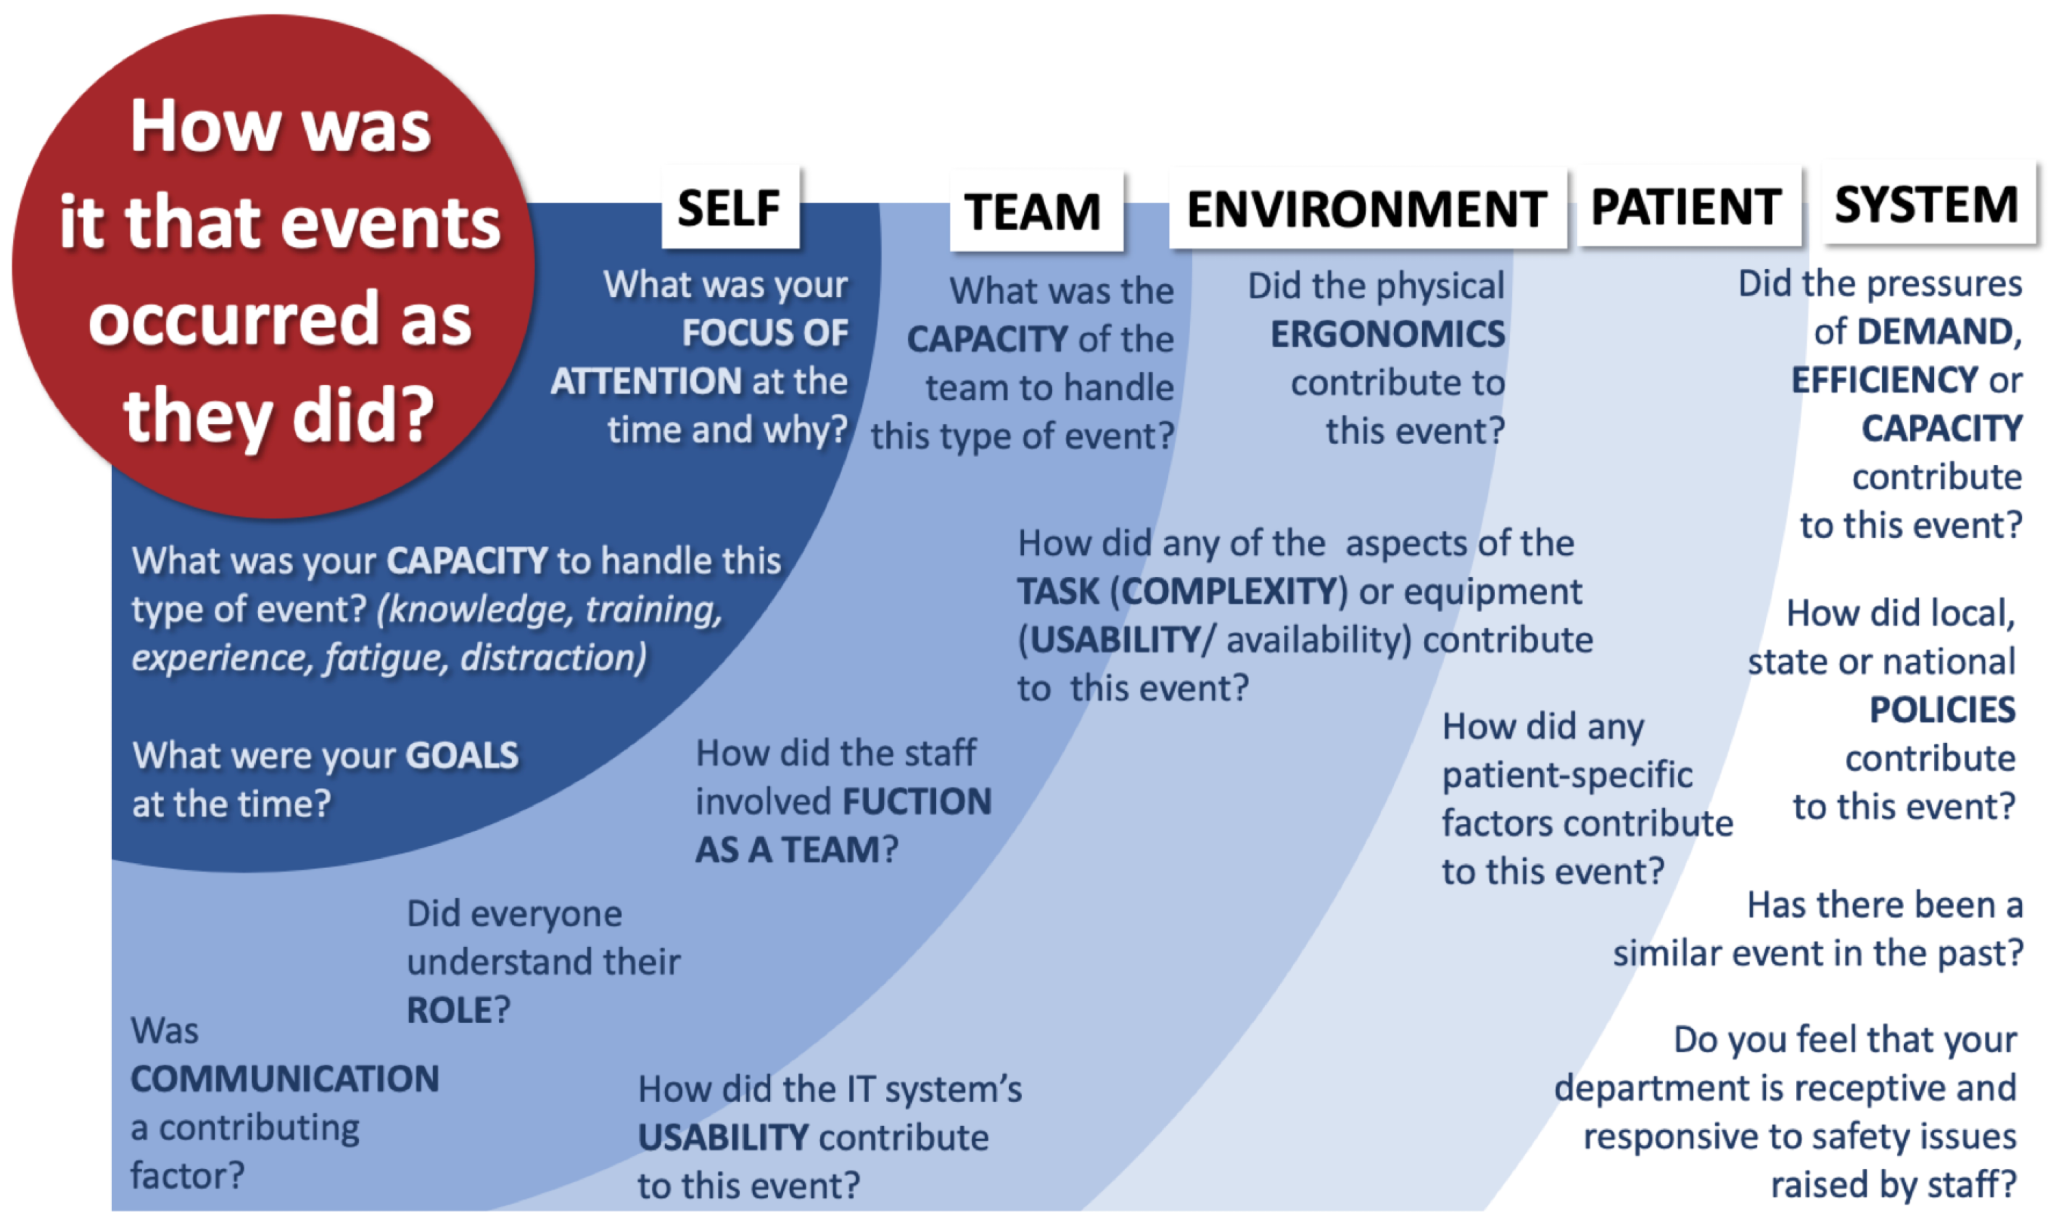
George Duoros presents a series of questions to guide the interviews when he collects this human factors data.
3c. Build a Thick Timeline
Now that you’ve collected information from the chart (or black box) as well as the humans involved with the event, overlay this human factors data on top of the thin timeline to build a thick timeline. This presents the events as they occurred within the context under which the providers were working. You may need to go back to interview providers until you can understand what happened as they understood it at the time. Then we achieve local rationality.

Another flow diagram of a near miss in which an metal oxygen canister is brought into an MRI room and nearly flies into the head of the MRI tech. Information from the chart is in the boxes. Information from the humans that provide the context is underneath the box. Though this diagram doesn’t show it, we will usually include date and time stamps on each of the events.
Step 4. Getting to the Root Cause
Once we have a good understanding of what happened using recorded data from the electronic medical record and provider accounts of what happened and why they made the choices they did, now we need a systematic process for analyzing what could have caused this adverse event.
4a. The 5 Why’s Technique
Sakichi Toyoda, the founder of Toyota Motors, and Taiichi Ohno, the father of Lean processes, created the five why technique to drill down deep past superficial causes and get to systemic reasons. Toyoda called his method “The Five Whys.” In this problem analysis technique, like a curious toddler you continually ask “why” until you get to the root cause of a problem.
Say you are working in a car factory where you missed your target. We want to find out what happened. Was it just that you’re an incompetent production manager? Not likely.
- We made 900 cars versus our target of 1,200? Why?
- Because the robot stopped. Why?
- Because it was overloaded and a fuse blew. Why?
- Because the arm wasn’t properly lubricated. Why?
- Because the lubrication pump wasn’t working right. Why?
- Because dirt and debris got into the pump shaft. Why?
- Because the pump motor was designed without a filter.2
- Because dirt and debris got into the pump shaft. Why?
- Because the lubrication pump wasn’t working right. Why?
- Because the arm wasn’t properly lubricated. Why?
- Because it was overloaded and a fuse blew. Why?
- Because the robot stopped. Why?
Obviously as this example demonstrates, you can ask “why” more than five times. The key is not to hit a particular number but to get to a root cause. Let’s look at a medical example, this time with more than one possible cause.
- There are delays in getting blood test results from the laboratory? Why?
- There are delays in ordering the blood tests. Why?
- Only physicians can order lab tests. They won’t let the nurses do it. Why?
- It’s Institutional Policy. Why?
- That’s just the way we’ve always done it. It may be worth considering nurse order sets.
- It’s Institutional Policy. Why?
- Only physicians can order lab tests. They won’t let the nurses do it. Why?
- But also, there are delays in processing tests. Why?
- Orders are batched by providers so we have to run many blood tests at one time causing congestion at the lab machine. Why?
- It’s more convenient for the providers to order the tests for several patients all at the same time instead of spacing them out. Why?
- It’s hard for the provider to find an available computer to order tests? Why?
- There’s not enough desk space for more computers. Why?
- The hospital ward is too small to accomodate more desks and computers. Maybe we should consider mobile devices.
- There’s not enough desk space for more computers. Why?
- It’s hard for the provider to find an available computer to order tests? Why?
- It’s more convenient for the providers to order the tests for several patients all at the same time instead of spacing them out. Why?
- But also, lab staff not always available to run all the tests. Why?
- Staffing patterns not matching demand. Why?
- The lab supervisor lacks expertise to conduct forecasting of demand and match staffing to it. Why?
- The lab supervisor has not had training in conducting forecasting. Perhaps we can get all the supervisors training.
- The lab supervisor lacks expertise to conduct forecasting of demand and match staffing to it. Why?
- Staffing patterns not matching demand. Why?
- Orders are batched by providers so we have to run many blood tests at one time causing congestion at the lab machine. Why?
- There are delays in ordering the blood tests. Why?
For this lab results delays example, we have two sub-causes, namely Delays in ordering tests and Delays in processing tests. For each sub-branch we continue the 5 Why approach until the root cause(s) are identified.
4b. Different categories of root causes
At Toyota, they noted that root causes typically fall into one of these categories: inadequate standard, inadequate adherence to a standard or inadequate system. Similarly in medicine, Charles Vincent identified several categories that should be explored when analyzing why an error occurred in medicine:
- Institutional context
- Organizational and management factors
- Work environment
- Team factors
- Individual staff members
- Task factors
- Patient characteristics
Examples of such errors are listed here.
| Type of Factor | Example7 |
| Institutional/regulatory | A patient on anticoagulants received an intramuscular pneumococcal vaccination, resulting in a hematoma and prolonged hospitalization. The hospital was under regulatory pressure to improve its pneumococcal vaccination rates. |
| Organizational/management | A nurse detected a medication error, but the physician discouraged her from reporting it. |
| Work environment | Lacking the appropriate equipment to perform hysteroscopy, operating room staff improvised using equipment from other sets. During the procedure, the patient suffered an air embolism. |
| Team environment | A surgeon completed an operation despite being informed by a nurse and the anesthesiologist that the suction catheter tip was missing. The tip was subsequently found inside the patient, requiring reoperation. |
| Staffing | An overworked nurse mistakenly administered insulin instead of an anti nausea medication, resulting in hypoglycemic coma. |
| Task-related | An intern incorrectly calculated the equivalent dose of long-acting MS Contin for a patient who had been receiving Vicodin. The patient experienced an opiate overdose and aspiration pneumonia, resulting in a prolonged ICU course. |
| Patient characteristics | The parents of a young boy misread the instructions on a bottle of acetaminophen, causing their child to experience liver damage. |
4c. Fishbone (Ishikawa) Cause-and-Effect Diagram
A common way of collecting the root causes while in a meeting with the team is the use of a fishbone diagram (or cause and effect diagram). The adverse event (effect) is placed at the head of the fish. Each rib of the fishbone represents one of the categories listed above. During discussion with the team, when a team member suggests a potential cause of the adverse event, it is placed on a branch coming off of the appropriate rib.
This is a useful tool for organizing the errors especially when working toward solutions.
Fishbone diagram or Cause and Effect Diagram
Occasionally we may have branches coming off of branches. In our lab delay example, we may have a fishbone diagram that starts out like this.
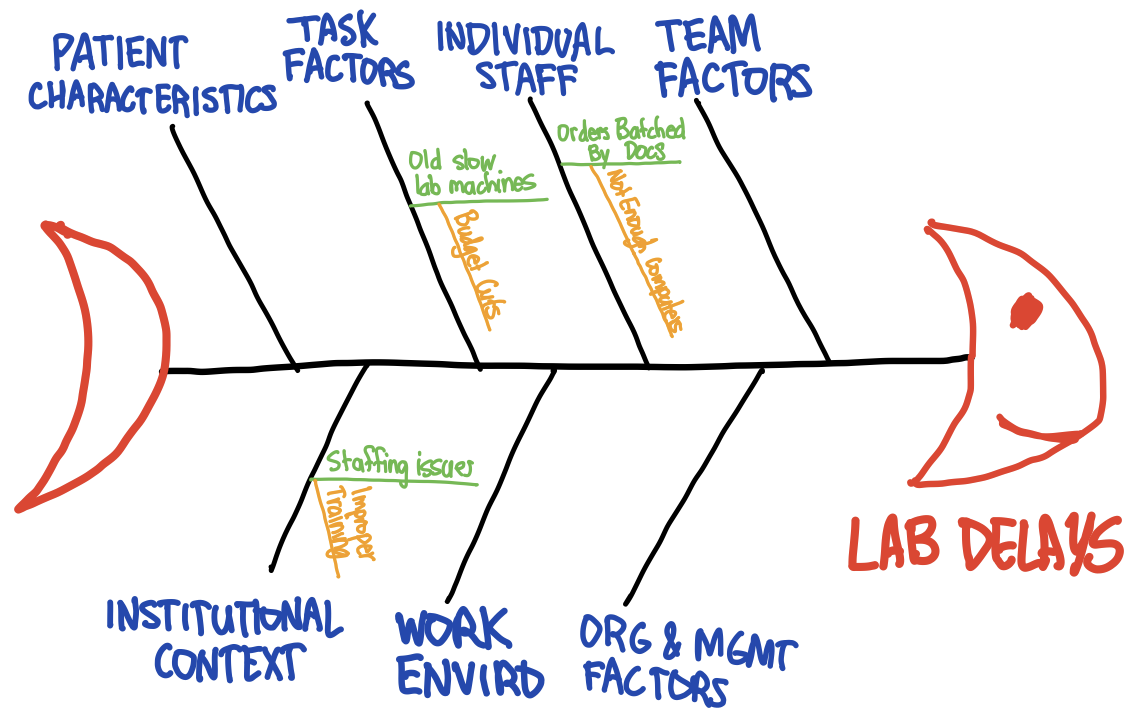
A fishbone diagram with branches coming off of the ribs, representing the discussion of the lab delay discussion. I know you’re impressed with my fish drawing skills.
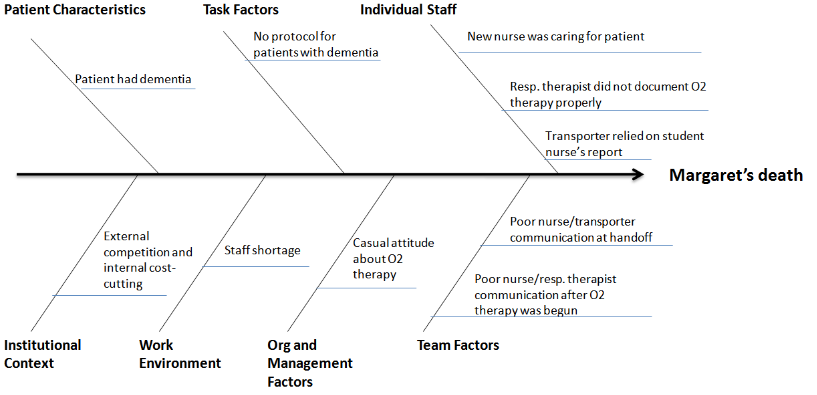
Here is another example of a fishbone diagram in use. This one matches the flow diagram example used above.
4d. Writing Causal Statements (5 rules)
Now that we’ve identified some potential causes, it’s time to record them within causal statements. A causal statement is structured as:
- The cause: “This happened…”
- The effect: “…which led to something else happening…”
- The event: “…which caused this undesirable outcome.”
These are recorded in causal statements and follow five rules of cause and effect
- Clearly show the cause and effect relationship.
- Use specific and accurate descriptors for what occurred.
- Human error must have a preceding cause. Never have human error as the cause, there’s no way to fix that. Instead ask, why did the human make the error? Human error is not an acceptable cause.
- Similarly, violations of procedure are not a cause and must have a preceding cause. Ask instead: why didn’t people follow procedure?
- Failure to act is only causal when there is a pre-existing duty to act.
Step 5. Identify Solutions
Once we have decided which root causes we want to address, we need to develop an action plan to address those causes and prevent future harm from occurring. Some of the common types of actions include:
- Standardizing equipment
- Ensuring redundancy, such as using double checks or backup systems
- Using forcing functions that physically prevent users from making common mistakes
- Changing the physical architecture
- Updating or improving software
- Using cognitive aids, such as checklists, labels, or mnemonic devices
- Simplifying a process
- Educating staff
- Developing new policies
5a. Prioritizing which causes to find solutions for
From the list of root causes the team usually picks one or two of these to address via an improvement plan using an impact-effort matrix. This is a simple matrix plotting whether something is high vs low effort against whether it will have a high vs low impact. We will want to pursue the easy to do (low effort) but high value (high impact) actions first.
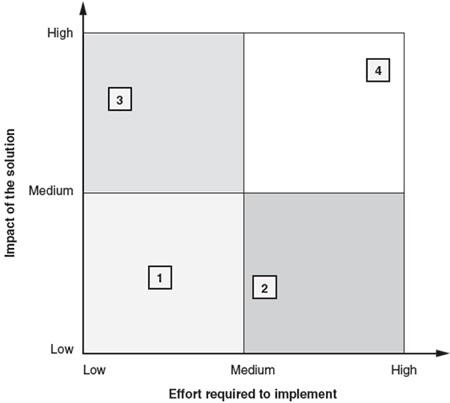
Impact Effort Matrix from the ASQ
The American Society for Quality (ASQ)10 recommends:
- Retrieve the suggested solutions from previous discussions
- Construct an empty diagram with the effort required to implement the solution on the horizontal axis and the impact of the solution on the vertical axis, and divide it into four quadrants.
- Assess the effort and impact for each solution. Place the solutions in the diagram according to these assessments. Use a symbol, color, or label to identify each possible solution.
- Solutions falling into the upper left-hand quadrant will yield the best return on investments and should be considered first.
5b. The hierarchy of controls
Once you’ve picked solutions The IHI adapted the National Institute for Occupational Safety and Health (NIOSH)’s Hierarchy of Controls to fit healthcare. Note that our most commonly used responses, telling someone to “do better” (aka training) or instituting policies, are some of the least effective methods.
Stronger actions lead to sustainable change, though they may be harder to implement. Conversely weaker actions are easier to do, but have less persistent results.
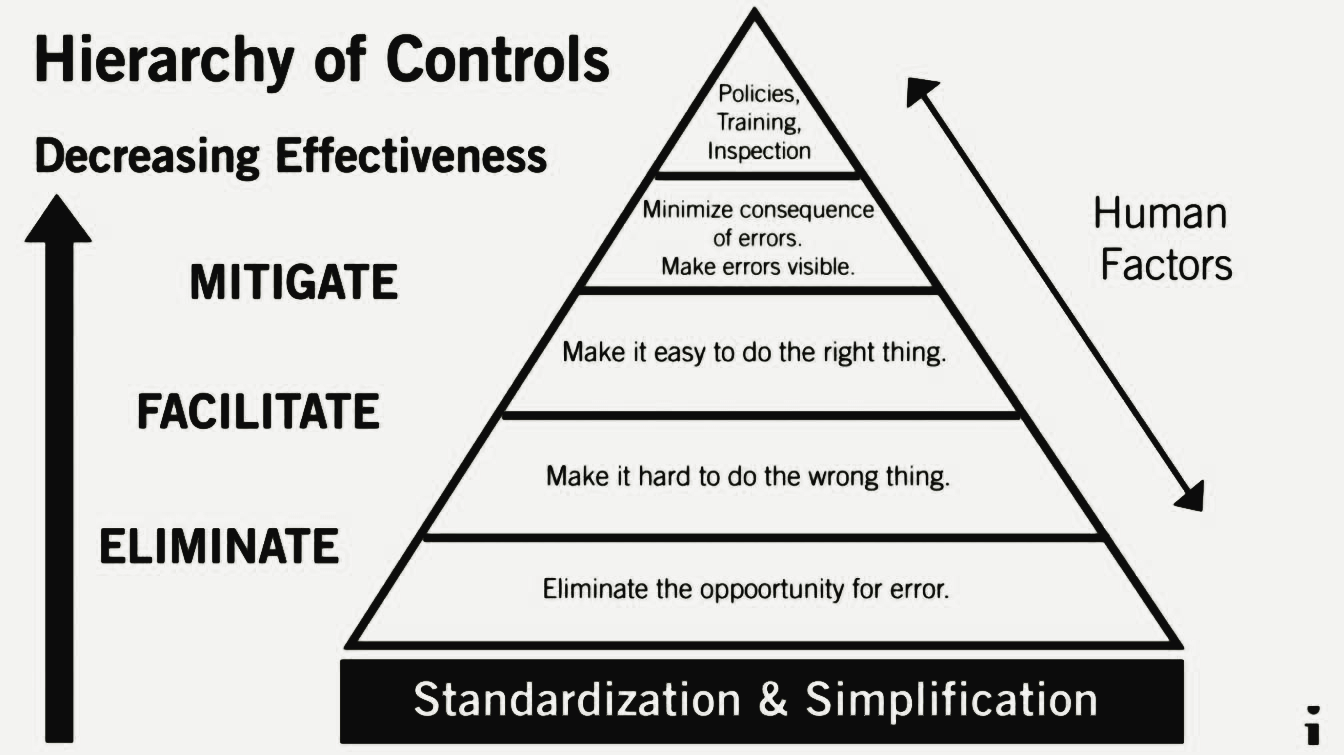
Hierarchy of Controls. In this pyramid, the least effective thing is at the top. The most effective actions are at the bottom.
There is not one single way to reduce errors; it will need to be a continuing process. A system used in industry to eliminate exposure to hazards and adapted by medicine is called the hierarchy of controls. From most to least effective, the controls are:
- eliminating a hazard (or eliminating the opportunity for an adverse event),
- substituting a hazard with a less hazardous one,
- engineering the environment to minimize the probability of the hazard,
- administratively mandating or educate that people avoid the hazard through policies or training, or
- accept the existence of the hazard and try to protect people from its effects.
What’s obvious from this framework is that our common response of telling people to “do better” — to be more vigilant or smarter — is not very effective. Instead we can adopt solutions from the following hierarchy:
- ELIMINATE the opportunity for error or exposure to a hazard. Redesign the process such that the hazard no longer exists. This is the most effective, though often the most expensive option especially if it requires redesigning existing processes.
- If a structure is normally constructed at a high height from which workers may fall, instead build that structure at ground level and move it to that height safely with a crane.
- If placing central lines leads to bloodstream infections, eliminate the need for placing the central line by delivering therapies through peripheral intravenous lines.
- During the COVID pandemic, mandate that everyone be vaccinated.
- SUBSTITUTE a hazard with a less hazardous one. This requires changes to equipment and procedures and so can be difficult to implement.
- A common example is substituting lead-based paint for water-based paint.
- Place all central lines in the sterile operating room, replacing the non-sterile ER room.
- Treat all people with a drug that makes the COVID virus less transmissible.
- ENGINEER CONTROLS to isolate people from hazards that cannot be eliminated or substituted. Essentially make it easier to do the right thing and harder to do the wrong thing.
- Simplify complex procedures that would normally prompt people to find potentially unsafe workarounds. Make the right choice the easier choice.
- Remove unnecessary equipment from the central line tray.
- Standardize processes so everyone is expected to follow the best practice. This also makes it easier to train and assess people.
- Have only one type of central line kit in the hospital so everyone uses and is familiar with the same thing.
- Automated computerized processes: the stroke order set ensures all patients with a potential stroke have the same appropriate testing completed
- Improving access to information to make good decisions avoiding the burden of having to search this information out.
- When calculating the PERC score to estimate the probability of a patient having a potentially fatal pulmonary embolus, the medical record auto-populates the patient’s age, pulse ox, etc and provides the result of the scoring system.
- Avoid reliance on memory to assist people in remembering all the steps in a procedure, eliminating memory lapses.
- Use a checklist when inserting a central line that includes all the steps in proper sequence: draping, gowning, site preparation, etc
- Eliminating environmental factors like clutter, bad lighting, interruptions and other distractions.
- A constraint makes it hard to do the wrong thing. A forcing function makes it impossible. These may be a hindrance when time is of the essence.
- Perform a time-out before doing all procedures (constraint)
- You can’t turn on cruise control when the windshield wipers are on, to prevent hydroplaning (forcing function)
- Bar code medication administration (constraint)
- The medication dispensing machine will not dispense drugs to which a patient has a listed allergy. https://www.ncbi.nlm.nih.gov/books/NBK225188/ (forcing function)
- Use visual controls: to shape desired behavior
- Simplify complex procedures that would normally prompt people to find potentially unsafe workarounds. Make the right choice the easier choice.
- Use ADMINISTRATIVE CONTROLS to change the way people work through policies, training and inspection. While enacting a policy can be the easiest thing to do, it is also the least effective.
- Mandating mask wearing and social distancing during the COVID pandemic.
- Enact a policy that all providers who place central lines must complete online training.
- Only nurses who have completed training can administer medication
- MINIMIZE CONSEQUENCES OF A HAZARD. This includes the use of personal protective equipment, building systems that can tolerate hazards and making errors quickly visible so corrective measures can be deployed.
- Perform scheduled CBC’s and temperature checks on patients who have recently received a central line so we can detect infections earlier.
- Those who must be exposed to biological hazards (Ebola or COVID) must wear personal protective equipment.
- Create robust systems that tolerate errors through redundancies.
Some examples of actions
- Stronger
- Architectural/physical plant changes: make the place safer with better design
- New devices with usability testing: make sure devices are easy to use.
- Engineering control (forcing function): make sure wrong things do not fit together via shaped connectors.
- Simplify processes: remove unnecessary steps
- Standardize on equipment or process
- Tangible involvement by leadership: work with staff and support the process
- Intermediate
- Redundancy: 2 independent people calculate doses (like MD and Rx)
- Increase staffing/decrease workload: hire people to work during busy times.
- Software enhancements, modifications: computer alerts, etc.
- Eliminate/reduce distractions: quiet rooms to do critical work, can’t bother a nurse when she’s calculating doses
- Education using simulation-based training, with periodic refresher sessions and observations
- Checklist/cognitive aids:
- Eliminate look- and sound-alikes
- Standardized communication tools: like read backs in a standardized way
- Enhanced documentation, communication: highlight medication names.
- Weaker
- Double checks: one person calculates and other double checks.
- Warnings: alarms
- New procedure/memorandum/policy
- Training
Once we have selected effective solutions for a small number of high impact and low effort causes, we start to work on implementing those solutions.
Steps 6, 7 & 8. Implementation, Measurement & Feedback
The action plans are often assigned to people outside of the team but who possess the authority to enact the plan. Clearly written recommendations make it easier for these people to accomplish the task. Use the same framework we use in Quality Improvement AIM statements: what needs to be done, how good, by when, and by whom.
While ideally this discussion is had while a plan is being developed, the people tasked with implementing the plan may note that the action plan as written isn’t feasible. Together the team and responsible person should work toward creating an appropriate alternative action.
Included in this plan with what we’re doing should be how we will measure progress.
- Process measures confirm that an action has been implemented.
- Outcome measures tell whether an action has been effective.
Some examples include:
| Process Measure | Outcome Measure |
| the number of people getting the hemoglobin A1C checked | rate of diabetes related complications in patients within a clinic. |
| the time it takes from making the decision to discharge a patient from the Emergency Room to writing their discharge papers | length of stay in the Emergency Department |
| percentage of people using a central line insertion checklist | number of central line associated bloodstream infections |
The final report should include
- Description of the RCA2 team members
- Description of the investigative methods used to gather info
- Description of what happened with final flow diagram
- Root causes and contributing factors (in causal statements)
- Recommendations for how to prevent this from happening again (action recommendations)
Rush’s Safety Event Review Form

Please complete the form below and send your findings and action plan back to the Patient Safety Committee by the date indicated below.
| Severity (Actual or Potential) | ||||
| Probability | Catastrophic | Major | Moderate | Minor |
| Frequent | 3 | 3 | 2 | 1 |
| Occasional | 3 | 2 | 1 | 1 |
| Uncommon | 3 | 2 | 1 | 1 |
| Remote | 3 | 2 | 1 | 1 |
MR#: 1234567 Last Name: XXXXX Department: Emergency Department
Date of Event: Return to Patient Safety by:
Date of Review: Type of Review Departmental Quality Review
| Brief Summary of Event: Write a brief summary of the adverse event. | ||
| Did the systems/processes work well as intended? Explain. | ||
| System Opportunities Identified from the Review: | ||
| Based on the opportunities identified above, please develop an action plan to address them. | ||
| Action Item | Responsible | Due Date |
| · | ||
| · |
Return to the example
Upon analysis of the case of the mixup of Ms. Joan Morris and Jane Morrison, the team found several active errors that occurred. Most of these “active errors” could have happened to anyone. Our goal in examining these cases is not to place blame, but to understand what happened and thus improve the system to prevent these errors from happening again.
Individual Errors in This Case6
- An unidentified person on the telemetry floor misdirected RN1 by saying patient Morrison” was not on the floor (when she was) and by saying that she had been transferred to oncology. (6:15 a.m.)
- An unidentified person on the oncology floor misdirected RN1 by saying the patient she sought (Ms. Morrison) was on the floor when she was not. (6:20 a.m.)
- An unidentified person on the oncology floor told RN2 to bring her patient (Ms. Morris, the wrong patient) to the electrophysiology laboratory. (6:30 a.m.)
- RN2 took her patient to the electrophysiology laboratory despite a) the patient’s objections, b) the lack of a consent form and order in the chart, and c) lack of knowledge on her own part or that of her charge nurse that the procedure was planned. (6:45 a.m.)
- RN1 failed to verify the patient’s identity against the electrophysiology laboratory schedule when the patient arrived in the electrophysiology laboratory. (6:45 a.m.)
- RN1 failed to recognize the significance of Ms. Morris’s objections to undergoing the procedure. (6:45 a.m.)
- The electrophysiology attending physician failed to verify Ms. Morris’s identity when he spoke with her by telephone, and he failed to understand the basis of her objections to the procedure. (6:45 a.m.)
- RN1 failed to appreciate the significance of the lack of an executed consent form in the chart, especially given that the electrophysiology schedule stated that the correct patient (Ms. Morrison) had signed the form. (6:45 to 7:00 a.m.)
- The electrophysiology fellow failed to verify the patient’s identity, failed to recognize the significance of the lack of pertinent clinical information in her chart, and failed to obtain consent that was informed. (7:00 to 7:15 a.m.)
- The electrophysiology charge nurse failed to verify the patient’s identity. (7:10 a.m.)
- RN3 failed to verify the patient’s identity. (7:15 to 7:30 a.m.)
- The neurosurgery resident did not persist to obtain a satisfactory answer to his question as to why his patient was undergoing a procedure about which he had not been informed. (7:30 a.m.)
- RN4 failed to verify the patient’s identity. (8:00 a.m.)
- The electrophysiology attending physician failed a second time to verify the patient’s identity when he did not introduce himself to Ms. Morris at the beginning of the procedure. (8:00 a.m.)
- The electrophysiology fellow disregarded the fresh groin wound from Ms. Morris’s cerebral angiogram the day before and started the electrophysiology procedure on the opposite side. (8:00 a.m.)
- A telemetry nurse (RN5) and two electrophysiology nurses (RN4 and RN4) failed to verify the identities of the patients they discussed on the telephone. (8:30 to 8:45 a.m.)
- The electrophysiology charge nurse failed to persist in obtaining a satisfactory answer to her question of why no patient with the name Joan Morris appeared on the electrophysiology schedule. (8:30 to 8:45 a.m.)
After examination of the “active causes,” the team used the 5 Why’s technique to identify potential “latent conditions” (systems issues that led to the errors) that could be corrected. Listed below are some of the solutions and corrective actions proposed.
Protocol Changes in Interventional Cardiology
- Internal e-mail schedule changed to match patient name with date of birth or medical record number.
- New protocol developed to verify patient identity, containing patient name, reason for procedure, written order, wristband check, wristband match to medical record, wristband match to schedule, and wristband match to white board posted in cardiology laboratory.
- Departmental scheduling system integrated into current hospital-wide identification and scheduling system (planned).
Hospital-Wide Protocol Changes
- Patients may not leave the floor for tests and procedures without a written order in chart authorizing the procedure.
- When a procedural area calls for a patient by telephone, nurse must match last name, first name, medical record number, and date of birth before
It is now up to hospital leadership to implement and monitor these changes for success.
References
- Institute for Healthcare Improvement. QI 201 – Root Cause Analysis
- Vanhaecht, Kris. “NHS must adopt a culture of ‘zero tolerance’ for patient harm, Francis report says.” BMJ 2013; 346 doi: https://doi.org/10.1136/bmj.f847 (Published 06 February 2013).
- Dennis, Pascal. “LEAN: A Plain-Language Guide to the World’s Most Powerful Production System.” CRC Press, 2015.
- http://www.cai.md.chula.ac.th/chulapatho/AFIP/AFIP%20fascicles/Afip_tumor%20of%20esophagus%20and%20stomach/afip_fascicle_fs18_text/www.afip.org/Departments/PSC/rules.html
- https://des.wa.gov/services/risk-management/about-risk-management/enterprise-risk-management/root-cause-analysis
- Mark R. Chassin, Elise C. Becher. The Wrong Patient. Ann Intern Med.2002;136:826-833. [Epub ahead of print 4 June 2002]. doi:10.7326/0003-4819-136-11-200206040-00012
- https://psnet.ahrq.gov/primer/root-cause-analysis
- Triggering questions for Root Cause Analysis. IHI. Accessed June 2021. http://www.ihi.org/education/IHIOpenSchool/Courses/Documents/RCA2_TriggerignQs.pdf
- NIOSH’s Hierarchy of Controls to Build Safer Systems. CDC Website. Accessed June 2021. https://www.cdc.gov/niosh/topics/hierarchy/default.html
- American Society for Quality (ASQ) Impact Effort Matrix. Accessed August 2021. https://asq.org/quality-resources/impact-effort-matrix
- Sydney Dekker’s “Field Guide to Understanding Human Error”
- EMCrit 249 – You Can Either Learn or You Can Blame – Fixing the Morbidity and Mortality Conference with George Douros